
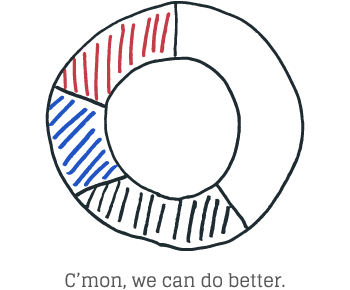
Once upon a project, we were using the Google Graph API to build donut charts. This worked great until it came time to print. See, Google Graphs have no viewBox. So when a user wants to print a page, the graph bursts out of its container and overlaps other elements on the page. We could hide the overlap, but the size of the chart wouldn’t change (Codepen)! By removing the Google Graph API and including a simple SVG inside a Twig template, I was able to get all the functionality of graphs with very little overhead and style it for print all at the same time. The SVG was reasonably straightforward. Just two <circle>s, but for the top one, we use some math to display only a portion of it. We could get tricky and put all the math in SCSS too (Codepen), but in the case of our display, the numbers were being piped straight to our template.
 Ugh, Math.
Yup. We're going to need some of that. Traveling back to our childhood, you hopefully remember that good ol' 2πR gets us our circumference. When we divide our circumference by the total number of pieces, we get a measurement we can use to show a single part of the donut. Then multiply by how many pieces we want to show for the entire portion displayed. To make it display, we use stroke-dasharray, which requires two numbers. For us, these are the length of total pieces we want to show and the difference between that and the circumference.
 Wait, What….?
 Wait, What….?
Let's say our circumference is 10. If you wanted to show 7 pieces (or 70%), your stroke-dasharray would be "7 3". For 5 pieces, stroke-dasharray="5 5". If only we could be so lucky as to have such an easy circumference every time!
Let the computer do the work
Here's some helpful markup I’ve developed. There is no π in Twig, so we use a bunch of decimal places. We also add a condition for when our displayed section is zero. If we don't, you'll see a small sliver of graph... which isn't zero in Graph World.
{# `currentcount` and `totalcount` are passed to the template via preprocessor. #}
<div id="chart">
<svg xmlns="http://www.w3.org/2000/svg" width="200" height="200" viewBox="0 0 100 100">
<g fill="none" fill-rule="evenodd" stroke-width="20">
{% set radius = 40 %}
<circle cx="50" cy="50" r="{{ radius }}" stroke="#e6e6e6"/>
{# Get measure of 1 graph portion. #}
{# ((2 * pi * R) / total) * number of portions #}
{% set portion = (2 * 3.14159265359 * radius) / totalcount %}
{# Get 25% of the circumference so we can spin the graph
90deg backward; positioning start at 12 o'clock. #}
{% set offset = (2 * 3.14159265359 * radius) / 4 %}
{% if currentcount > 0 %}
<circle cx="50" cy="50" r="{{ radius }}" stroke="#33cc33" stroke-dasharray="{{ portion * currentcount }} {{ portion * (totalcount - currentcount) }}" stroke-dashoffset="{{ offset }}"/>
{% endif %}
</g>
</svg>
</div>
Bringing it full circle
 Bringing it full circle
Now that we're able to build the graph with a viewBox, we can easily resize it when printed. The only hang-up here was with Firefox, which wanted something more than width: 100%. Thankfully, a print is (mostly) a fixed size. Setting width to a fixed pt size sorted it. That's it! There’s no need for an external library. We have the power of Drupal's preprocessors along with math support directly in Twig.