
Did you know that studies show that almost 80% of Americans now shop online? For small businesses, this means having an online strategy is essential to reaching today’s customers.
While it can be challenging selling and marketing your products online, it also offers unique benefits. Tracking the return on your brick and mortar sales is tricky enough. It gets even harder when you’re trying to track the return on your print, radio, or skywriting advertisements! Luckily, online marketers can easily track the success of their online campaigns!
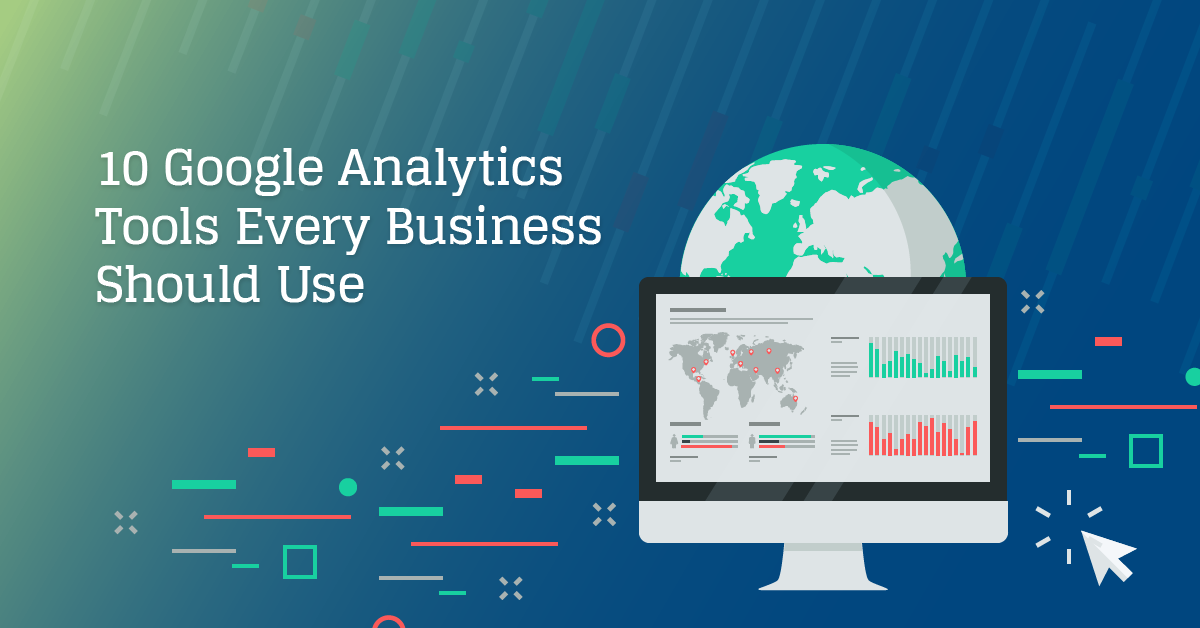
With the power of free Google Analytics tools, you can track your traffic down to the last detail. That includes where your traffic comes from, where people spend time on your page, and even what pathways customers take to convert. Knowing this info can help you identify what’s working, and what isn’t. Ultimately, it’ll help you develop better strategies.
1. Goals and Conversions
If you’re going to start using Google Analytics, your first move should be to set up your goals so you can track your conversions. When you set up goals for the kinds of actions you want your visitors to take it will help you to better understand if your website is getting the results you want.
In the goals section, you can start tracking every time a customer buys a certain product. These tools will allow you to track how often this product is sold, how people who buy the product find your website, and what pages they visit before they finally make the purchase.
Additionally, you can attach a dollar value to your goals. This will allow you to track how valuable certain pages or referrers are, and modify your strategy accordingly.
2. Audience Location
Under the audience tab on Google Analytics, you can select the Geography option to see what part of the world your visitors come from. You can filter by country, province (or state), and metropolitan area.
This tool can be particularly useful if you have a website for a place-based business. For instance, if you have a website for a car dealership or a restaurant, you can use this tool to make sure the traffic you are driving is actually from your local area.
Even if you have an exclusively online business, this information can still be helpful. If you find that most of your traffic is coming from a certain part of the world, you can use that information to target your advertising strategies. Maybe your ads resound more with elderly Irish pro-wrestling fans than you thought!.
3. Landing Page
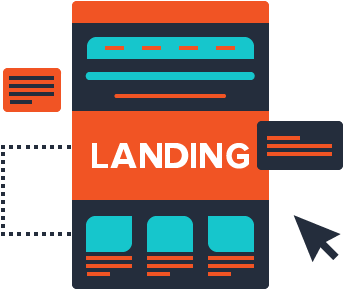 While building your website, you often think of the home page as the first page that visitors will see when they come to your site. While that’s usually true, it is frequently not always the case. Often, organic search, referral links, or advertisements, will lead users to directly to a subpage on your site.
With the Google Analytics landing page tool, you can easily track the pages your users most commonly land on. This way, you can make sure that your pages are designed to welcome users to your business, and direct them to where you want them to go.
4. Page Bounce Rates
In addition to tracking what pages users land on, you also want to find out which pages make users want to stay, and which ones make them to leave. You can do this by paying attention to the bounce rate.
The bounce rate measures the number of users who leave your website after visiting a specific page. By keeping track of the bounce rate on your landing pages, you can evaluate which pages are effective at drawing people in, and which are driving people away.
5. Traffic Sources
Sure, it’s important to see how users behave once they get to your website, but it’s also important to track how they find your website in the first place! You can do this by looking at your acquisition reports.
Your acquisition reports will show you how much traffic you’re getting from organic search, direct sources, referral links, and social media. You can also get more specific information by looking at the full referrer to find out the exact website that referred the user to your site.
6. Social Media Dashboard
Want to learn more about how social media is driving traffic to your site? Is that Instagram campaign really converting, after all? Well you can get the information you need on the social media dashboard! This dashboard shows you what content on your site users are sharing and also shows which social media paths are bringing in the most traffic to your site.
7. Mobile Traffic Behavior
It’s 2018 and we have the entirety of human knowledge on rectangles made of metal, glass, and plastic that we keep in our pocket. It’s the future! That means that tons of your visitors will be coming to your website from a mobile device. With the mobile traffic reports included in Google Analytics, you can see what pages are most popular with mobile users. This can help you prioritize what content to make mobile friendly, and identify poorly performing pages.
Similarly, you can use this report to find out what devices your users are using. This will help you determine what screens to design your content for, and gives yet another demographic datapoint.
8. Content Drilldown
If your website uses categories in its architecture, you will find the content drilldown report very helpful. This report breaks down the different traffic you get based on the different sections of your site.
For example, it can group all blog posts together, rather than just reporting on individual posts. This will help you figure out what sort of content on your site is most popular.
9. Funnel Visualizations
Want to see what paths people take to convert? Use the funnel visualization! This shows you the customer journey all the way from the point of referral to conversion. It can also show you the point at which customers drop off rather than converting.
10. Analytics Alerts
If you want to keep tabs on your analytics, the best way to do so is through analytics alerts. This way, you can be notified whenever you reach a certain number of conversions or a certain level of traffic for the day. With alerts you’ll never miss out on important analytics information.
 Put Google Analytics Tools to Work Today
 Put Google Analytics Tools to Work Today
By using Google Analytics and all of its tools, you’ll learn more about your customers, and develop better strategies to drive traffic and boost conversions. With these tools, you will be able to understand how your marketing campaigns are working, and how to make them more effective.
Ready to get started optimizing your website? Contact us today to get our expert help with your next online project.